pixdeluxe
The ongoing transformation of the energy landscape is imminent. Moving towards renewable sources of energy is boosted by political support. Several companies are involved in building this infrastructure and might be the beneficiaries for the several years of transit. Today I would like to analyze MYR Group (NASDAQ:MYRG) a company with a deep interest in renewable power projects and expertise in industry. With the multiples analysis and deep dive into the company`s statements, I will come up with my price target, explaining why the current price is not the best entry point.
Company Overview
MYG is a holding company, based in the US and specializes in electrical construction service. There are 2 segments the company operates in: Transmission and Distribution (T&D), Commercial and Industrial (C&I). The first segment generates 58% of revenues (for the year ended December 31, 2022), and the top 10 customer contracts continue to prevail. Most of the contracts are fixed-price, thus the cost increase affects the gross margin.
| Year | 2022 | 2021 | 2020 | 2019 | 2018 | 2017 |
| ROIC | 14.56% | 16.82% | 11.98% | 8.69% | 8.59% | 6.71% |
| ROE | 15.45% | 17.93% | 14.81% | 10.97% | 10.19% | 7.69% |
Source: Author based on Morningstar data.
Since the year 2017, the company significantly increased its return on equity and, more essentially, return on invested capital, reaching a trailing interest rate of 13.67%. As a consequence, this led to an astonishing almost 63% Total 1-year Return to its shareholders, being amongst the leaders in industry performance.
MYRG 1-Year Total Return (SeekingAlpha)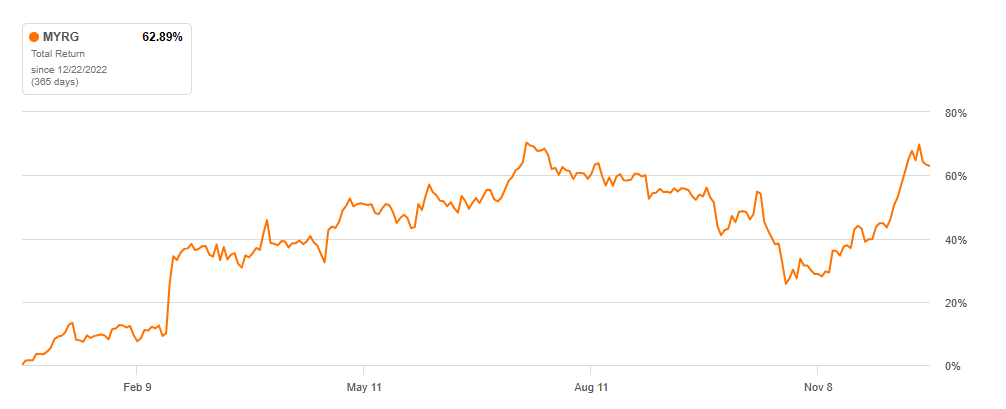
Peer analysis
Sector Median | 5Y Average | ||
P/E Non-GAAP (FWD) | 26.35 | 19.23 | 17.91 |
EV/Sales | 0.7 | 1.83 | 0.5 |
EV/EBITDA (FWD) | 13.32 | 11.59 | 8.65 |
P/S (FWD) | 0.68 | 1.41 | 0.47 |
P/B (FWD) | 3.77 | 2.72 | 2.4 |
1-Year Total Return | 62.89% | 54.61% |
Source: Author based on SeekingAlpha data.
MYR Group is trading at multiples higher than its 5-year average and peers' median. EV/Sales and P/S are lagging historically to median numbers. The Total Return number suggests that the sector was worth investing in, generating almost 55% for the past year in its median, MYGR was amongst the companies that outperformed the number, with multiples suggesting positive future growth expectations.
Latest Quarterly Results and past performance
Year | 9M 2023 | 9M 2022 | 2022 | 2021 | 2020 | 2019 | 2018 |
Operating revenue | 100.00% | 100.00% | 100.00% | 100.00% | 100.00% | 100.00% | 100.00% |
Cost of sales | 89.89% | 88.45% | 88.57% | 86.99% | 87.73% | 89.66% | 89.09% |
Gross margin | 10.11% | 11.55% | 11.43% | 13.01% | 12.27% | 10.34% | 10.91% |
Operating expenses | |||||||
General and administrative expenses | 6.62% | 7.67% | 7.39% | 8.29% | 8.39% | 7.56% | 7.75% |
Depreciation and amortization | 0.14% | 0.32% | 0.30% | 0.09% | 0.16% | 0.19% | 0.12% |
Other expenses, net | -0.12% | -0.08% | -0.08% | -0.12% | -0.13% | -0.17% | -0.25% |
Total operating expenses | 6.63% | 7.91% | 7.61% | 8.26% | 8.42% | 7.58% | 7.62% |
Core operating income (before tax) | 3.48% | 3.64% | 3.82% | 4.75% | 3.85% | 2.76% | 3.29% |
Tax on operating income | |||||||
Tax as reported | 0.85% | 0.91% | 1.02% | 1.25% | 1.01% | 0.69% | 0.77% |
Tax on other operating income | 0.00% | -0.02% | -0.02% | 0.00% | 0.01% | 0.01% | 0.05% |
Tax benefit from net interest expenses | 0.02% | 0.02% | 0.02% | 0.01% | 0.04% | 0.06% | 0.05% |
Total tax on operating income | 0.87% | 0.91% | 1.03% | 1.27% | 1.05% | 0.76% | 0.87% |
Core operating income (after tax) | 2.61% | 2.73% | 2.79% | 3.47% | 2.80% | 2.01% | 2.42% |
Other operating income (expense) (before tax) | |||||||
Other income | 0.00% | 0.12% | 0.09% | -0.02% | -0.03% | -0.02% | -0.24% |
Tax on other operating income | 0.00% | -0.02% | -0.02% | 0.00% | 0.01% | 0.01% | 0.05% |
0.00% | 0.09% | 0.07% | -0.02% | -0.02% | -0.02% | -0.19% | |
Other operating income (expense) (after tax) | |||||||
Currency translation gains (loss) | -0.01% | -0.36% | -0.22% | 0.01% | 0.02% | -0.01% | 0.01% |
Operating income after tax | 2.59% | 2.46% | 2.64% | 3.46% | 2.80% | 1.97% | 2.24% |
Financial income | |||||||
Interest expense | -0.12% | -0.08% | -0.13% | -0.07% | -0.17% | -0.24% | -0.14% |
Interest income | 0.03% | 0.00% | 0.01% | 0.00% | 0.00% | 0.00% | 0.00% |
Net interest Income (expense) before tax | -0.09% | -0.08% | -0.13% | -0.07% | -0.17% | -0.24% | -0.14% |
Tax benefit of debt | 0.02% | 0.02% | 0.03% | 0.01% | 0.04% | 0.05% | 0.03% |
Net financial income (expense) | -0.07% | -0.07% | -0.10% | -0.05% | -0.14% | -0.19% | -0.11% |
Comprehensive income (available to common) | 2.52% | 1.93% | 2.91% | 3.23% | 2.24% | 1.42% | 1.18% |
Source: Author's calculations based on MYRG financial statements.
Despite the increased cost of sales (due to inflation and prevailed fixed-costs agreements), the company continues to show stable operating income and the comprehensive income times the sales even increased past 9 months compared to last year's same period (normalized to current sales). Currency translation loss had just a minor negative effect on the overall results. Strong performance in T&D was the main driver of the growth, with global clean energy projects boosting the segment. Despite the segment being cyclical, further stimulation of green energy will positively affect the company's results.
T&D segment revenue growth (MYRG investor presentation)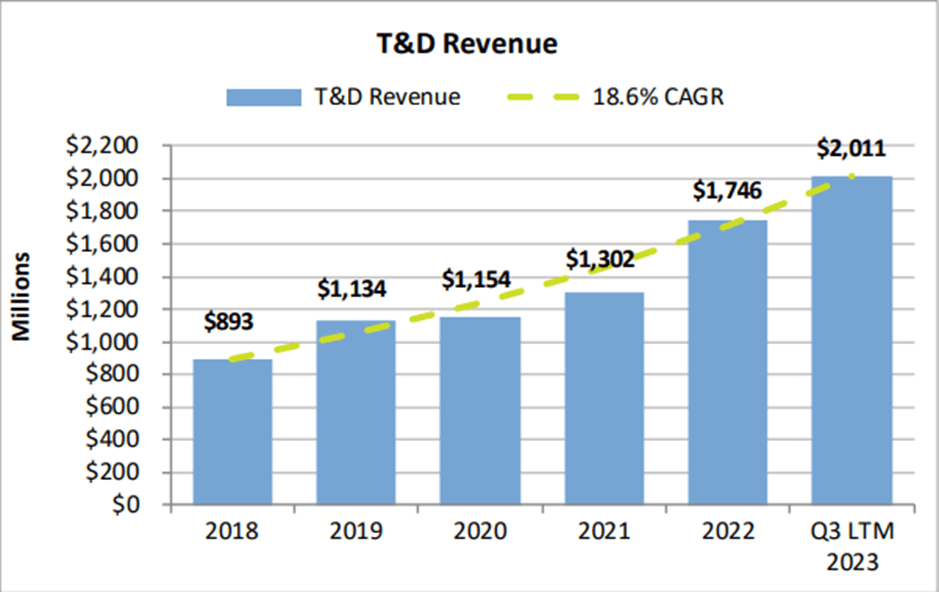
Risks
The business is highly cyclical, depending on the industries it serves, which may affect operating results. Increased costs result in lower gross margins, especially fixed-priced contracts that are at risk. Some of the losses from the operations are not covered by insurance.
Impairments and Supply Chain disruptions can negatively affect future results.
Canadian dollar exchange rate may impact the US dollar value of profits as well as assets held in Canada, potential instability in markets may harm the operations.
Printability may be reduced due to warranty claims and faulty engineering. Dependence on third-party suppliers exposes to risks of loss in operations.
Due to regulation initiatives regarding electric transmission and clean energy, it is impossible to forecast whether the demand for the services will rise. As T&D generates the vast majority of revenues, there are risks for operations.
Valuation methodology
I used the same methodology as in my previous articles. The only difference is that I forecasted balance sheets till 2028. The required return is outsourced but adjusted and WACC-calculated. Balance inputs depend on the sales figures of the company, which are in line with the company`s overview. The long-term growth rate for continuing value equals the expected US GDP growth rate. Forecasted sales figures are based on average past growth rates.
Valuation inputs and results
The income statements and balance sheets were simulated, with the sales 2023 fiscal year forecasted. The tax rate is equal to the federal statutory rate.
Residual operating income is the difference between the return on operating assets and the required return.
| 2023 | 2024E | 2025E | 2026E | 2027E | 2028E | |
| Income statement | ||||||
| Sales | 3580165 | 3794975 | 4022673 | 4264034 | 4519876 | 4791068 |
| Cost of sales | 2664580 | 3339578 | 3539953 | 3752350 | 3977491 | 4216140 |
| Gross margin | 393818 | 455397 | 482721 | 511684 | 542385 | 574928 |
| Residual Operating Income ((ReOI)) | 37977 | 61627 | 78218 | 102534 | 108686 | 115207 |
| Cost of operations | 7.21% | |||||
| Total Present Value (PV) of ReOI to 2023 | 372390 | |||||
| Continuing value (CV) | 625449 | |||||
| PV of CV | 1593896 | |||||
| Value of common equity | 2526487 | |||||
| Number of shares outstanding | 16710 | |||||
| Value per share | $151.20 |
(in thousands of US Dollars, except per share data)
Valuation risk
The growth rate represents the average of past performance, even a slight change will affect the price. If the growth rate continues to rise next year, it will result in a higher price target. Due to accounting principles, some of the figures I used in my reformulation might be slightly off, but I tried to minimize their influence. The latest quarter statements are unaudited and lack some disclosure, although this had only a minor effect on my calculations. WACC calculations are outsourced, but reasonably match my own. The company`s beta is sensitive to market volatility, which may result in increased/decreased cost of operations rate, affecting the value. Year's end sales figures are forecasted, and the real number may not reach the level, but they are in line with the average sales forecast.
Conclusion
Although my calculations suggest that the company is undervalued now and has a 4% upside opportunity, I would suggest "Hold". There are several reasons. First, after such a strong market performance there should be a correction, which will give a better entry point. Second, the company (with its 4th Quarter results) has to prove the trajectory and maybe even increase my valuation. Third, it must be reaffirmed that we are on the way to decreasing interest rates and increasing company sales. With all of these unknowns, I would wait for a better entry point.